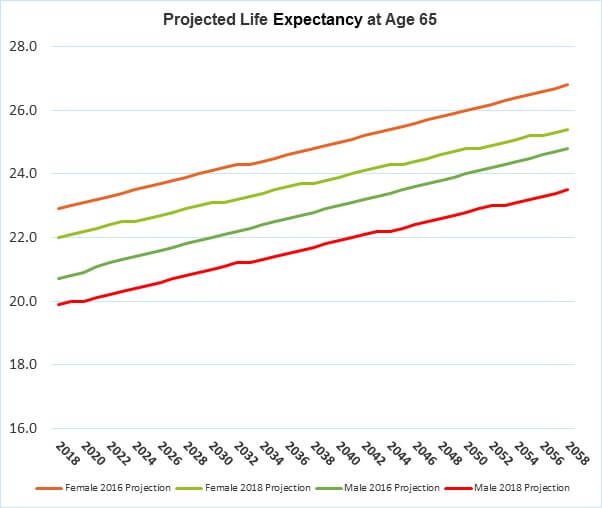
New calculations from the Office for National Statistics have lowered life expectancies.

Source: ONS
Every two years, the Office for National Statistics (ONS) recalculates its national population projections (NPP). As part of the exercise, the ONS reviews and updates its assumptions about future mortality, which in turn will have an impact on population size.
The latest figures, released in early December, show a fall in life expectancies from those calculated in 2016, as the graph above demonstrates. As a headline, ‘Fall in Life Expectancy’ can be confusing. What it does not mean is that future generations will not live as long as the current generation. What it does mean is that future generations will live longer than the current generation, but not live quite as long as previously predicted.
You can see this in the graph. The projection made in 2016 was that a man who reached age 65 in 2040 would live, on average, another 23.0 years, whereas the latest projection (based on 2018 figures) brings that number down to 21.9 years. In 2014 the figure was projected to be 24.1 years. For women the figure has gone down from another 25 years in 2016 to 23.9 years in 2018.
The ONS reductions in life expectancy were unsurprising to the experts, as a near stalling in UK life expectancy improvements had already been noticed by health think tanks and pension funds, among others. The causes are the subject of some debate. As the Health Foundation remarked on its research, “These causes are multiple and complex – working across all age-groups, seasons and both sexes…some of the simplified explanations that have been advanced are clearly inadequate.”
One consequence of these new projections is that the ONS has had to update its life expectancy calculator. It is worth looking at this, not only for the average life expectancy number, but also for the graph and other data which accompany the results. For example, a man aged 65 today (which is no longer State Pension Age, don’t forget – it’s about 65 and two-thirds), is expected on average to live until age 85, but has a 1 in 4 chance of reaching 92 and a 1 in 10 chance of achieving age 96. For a woman of the same age, the corresponding figures are all two years higher.
Those odds of reaching into the 90s are worth remembering next time you review your retirement planning.
The value of your investment can go down as well as up and you may not get back the full amount you invested. Past performance is not a reliable indicator of future performance.
Content correct at time of writing and is intended for general information only and should not be construed as advice.
